Why Learning to Calculate NPV Matters
When evaluating investments, expansion projects, or financial opportunities, one of the most reliable tools analysts rely on is Net Present Value (NPV). In its simplest form, NPV represents the difference between the present value of future cash inflows and the present value of cash outflows. By discounting future earnings to today’s value, it helps determine whether an investment is likely to create wealth or erode it. This makes mastering how to calculate NPV an essential skill for professionals in finance, business, and strategy.
Understanding NPV calculation basics is more than just a technical exercise—it provides clarity in decision-making. Businesses use NPV to compare competing projects, investors use it to assess whether a venture is worth pursuing, and financial analysts apply it to measure long-term value against upfront costs. Without accurate NPV calculations, organizations risk overestimating returns or underestimating risks. Learning how to calculate NPV empowers decision-makers to make informed, data-backed choices that align with their financial goals and long-term strategies.

The NPV Formula Explained
At its core, the concept of Net Present Value is captured in a straightforward mathematical expression:
NPV = Σ [Cash Flow ÷ (1 r)^t] – Initial Investment
This NPV formula allows professionals to break down the value of future cash inflows into present-day terms. Each element in the equation plays a critical role:
- Cash Flows (CF): The expected inflows or outflows at each period, such as revenues, cost savings, or expenses.
- Discount Rate (r): Often based on the cost of capital or required rate of return, it reflects the risk and opportunity cost of tying up capital.
- Time Period (t): The year or period when the cash flow occurs, with later periods discounted more heavily.
- Initial Investment: The upfront cost needed to fund the project or investment.
To understand how to calculate NPV manually, consider a simple example. Suppose a project requires an initial investment of $1,000 and promises to return $500 at the end of each of the next three years. If the discount rate is 10%, the present value of each year’s $500 cash flow is:
- Year 1: 500 ÷ (1 0.10)^1 = $454.55
- Year 2: 500 ÷ (1 0.10)^2 = $413.22
- Year 3: 500 ÷ (1 0.10)^3 = $375.66
Adding these gives a total present value of $1,243.43. Subtracting the initial investment of $1,000 results in an NPV of $243.43. Because the NPV is positive, the project is considered financially attractive.
This example demonstrates not only the mechanics of the NPV formula but also its power in guiding investment decisions by showing whether an opportunity truly adds value today.
How to Calculate NPV in Excel
One of the most practical ways to work with Net Present Value is through Microsoft Excel, as it provides built-in functions that simplify the process. Instead of manually discounting each cash flow, Excel allows you to compute results in seconds, which is why professionals across industries rely on it. Understanding how to calculate NPV in Excel is an essential skill for anyone involved in financial analysis, investment planning, or project evaluation.
Step 1: Using the =NPV() Function
The =NPV() function is designed to calculate the present value of a series of future cash flows at a specified discount rate. The formula structure is:
=NPV(discount_rate, value1, [value2], …)
- discount_rate is your cost of capital or required rate of return.
- value1, value2, … are the series of cash flows across different periods.
For example, if you have annual cash inflows of $500 for three years with a discount rate of 10%, you would enter:
=NPV(10%, 500, 500, 500) - 1000
Step 2: Using the =XNPV() Function for Irregular Cash Flows
Real-world projects often involve cash flows that do not occur at regular intervals. Excel addresses this with the =XNPV() function, which allows you to pair each cash flow with its exact date. The formula is:
=XNPV(discount_rate, cash_flows, dates)
This makes it highly accurate when payments are irregular, such as in loan repayments, phased investments, or project milestones.
Step 3: Sample Table in Excel
Here’s a simple example table:
| Year | Cash Flow |
| 0 | -1000 |
| 1 | 500 |
| 2 | 500 |
| 3 | 500 |
If the discount rate is 10%, entering =NPV(10%, B2:B4) B1 gives the result of $243.43. This shows how quickly Excel can validate whether a project adds financial value.
By mastering these functions, you gain speed, accuracy, and flexibility in financial modeling, ensuring you never miss critical insights when evaluating investments.
How to Calculate NPV Using WACC
The Weighted Average Cost of Capital (WACC) represents the average rate a company is expected to pay to finance its operations through both debt and equity. It combines the cost of equity (returns required by shareholders) and the after-tax cost of debt (interest paid to lenders), weighted by their proportion in the company’s capital structure. Because it reflects the minimum return a company must earn to satisfy its investors and creditors, WACC is widely used as the discount rate in Net Present Value calculations.
When learning how to calculate NPV using WACC, the process mirrors the standard NPV formula, but instead of choosing an arbitrary discount rate, the company’s WACC is applied. This ensures that the project is evaluated against the true cost of financing. If the NPV remains positive after discounting cash flows at WACC, the project is expected to add value beyond its financing costs.
Example: Applying WACC in NPV
Suppose a company has a WACC of 8% and is evaluating a project requiring an initial investment of $2,000. The project is expected to generate cash inflows of $900 in Year 1, $1,000 in Year 2, and $1,200 in Year 3. Using the NPV formula with WACC as the discount rate:
- Year 1: 900 ÷ (1 0.08)^1 = $833.33
- Year 2: 1,000 ÷ (1 0.08)^2 = $857.34
- Year 3: 1,200 ÷ (1 0.08)^3 = $952.38
The total present value of inflows is $2,642.05. Subtracting the initial $2,000 investment results in an NPV of $642.05.
This example highlights the relationship between WACC and NPV: if cash flows discounted at the company’s cost of capital yield a positive NPV, the project is not only profitable but also aligned with shareholder expectations.
How to Calculate IRR from NPV
The Internal Rate of Return (IRR) is another widely used metric in investment appraisal, closely connected to Net Present Value. By definition, IRR is the discount rate at which the NPV equals zero. In other words, it represents the break-even rate of return—if a project’s actual return exceeds the IRR, it adds value; if it falls below, the project destroys value.
To understand how to calculate IRR from NPV, start with the NPV formula. Since NPV is highly sensitive to the discount rate, different rates produce different values. The IRR is found by adjusting the discount rate until the sum of discounted cash flows minus the initial investment equals zero. While this can be solved through trial-and-error, in practice professionals often use financial calculators or software such as Excel’s =IRR() function for speed and accuracy.
Step-by-Step Process
- Calculate NPV using an initial guess for the discount rate.
- Adjust the discount rate upward or downward depending on whether the NPV is positive or negative.
- Repeat the process until NPV approaches zero.
- The discount rate that brings NPV closest to zero is the IRR.
Example: IRR and NPV in Action
Suppose a project requires an investment of $1,000 and generates $500 annually for three years. At a 5% discount rate, the NPV is positive at $272.32. At a 20% discount rate, the NPV drops to -$45.65. Because the IRR lies between these two rates, further refinement (or Excel’s =IRR() function) shows the IRR is approximately 18%.
This example illustrates the relationship between IRR vs NPV: while NPV provides an absolute measure of value creation, IRR gives the rate of return at which value creation just breaks even. Both metrics together give a more complete picture for investment decision-making.
How to Calculate IRR Manually with NPV
While financial software and Excel functions make IRR calculations fast, there are times when analysts may need to estimate it manually. Understanding how to calculate IRR manually with NPV provides a deeper appreciation of how discount rates influence project value and strengthens fundamental financial skills.
The most common manual method is interpolation. Since IRR is the discount rate at which NPV equals zero, you start by calculating NPV at two different discount rates—one that produces a positive NPV and another that produces a negative NPV. Because IRR lies between these two rates, interpolation allows you to estimate it more accurately without endless trial-and-error.
Interpolation Formula for Manual IRR Calculation
[caption id=attachment_32185 align=aligncenter width=532]

Interpolation Formula for Manual IRR Calculation[/caption]
- r₁ = lower discount rate (NPV positive)
- r₂ = higher discount rate (NPV negative)
- NPV₁ = NPV at r₁
- NPV₂ = NPV at r₂
Example: Manual IRR Calculation
Suppose an investment requires $1,000 and yields $500 annually for three years.
- At 10%, the NPV = $243.43
- At 20%, the NPV = –$45.65
Applying the interpolation formula:
[caption id=attachment_32186 align=aligncenter width=635]
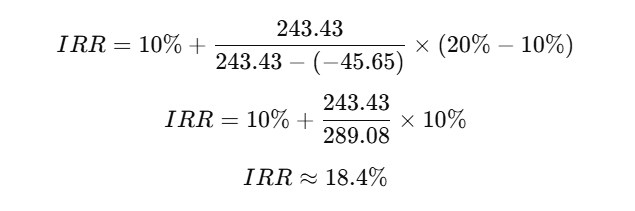
Manual IRR Calculation[/caption]
This manual method shows that the IRR falls between the two tested rates, providing a close estimate without relying on software. While not as precise as automated tools, manual IRR calculation is a valuable technique for understanding the mechanics behind investment appraisal.
Common Mistakes in NPV and IRR Calculations
Even though NPV and IRR are fundamental tools in financial analysis, errors often creep in during their application. These mistakes can distort results and lead to poor investment decisions. By being aware of the most common pitfalls, professionals can ensure their calculations remain accurate and meaningful.
-
Using the Wrong Discount Rate
One of the most frequent NPV errors involves selecting an inappropriate discount rate. The discount rate should reflect the project’s risk profile and the company’s cost of capital. Using a rate that is too high undervalues future cash inflows, while a rate that is too low can make risky projects look profitable.
-
Confusing Average Return with NPV
Another common IRR calculation mistake is equating average returns with NPV. Unlike a simple average, NPV accounts for the time value of money and discounts each cash flow. Ignoring this distinction may cause analysts to overestimate the attractiveness of an investment.
-
Misclassifying Irregular Cash Flows
When cash flows occur at uneven intervals, relying on the standard NPV function can lead to inaccurate results. This is where Excel’s XNPV function becomes crucial. Failing to use the correct tool for irregular timing is a frequent oversight that undermines accuracy.
By avoiding these pitfalls, professionals can strengthen the reliability of both NPV and IRR analysis, ensuring that decisions are based on precise financial insights rather than miscalculations. Also Read: Best Way to Invest in Stocks
FAQs on NPV and IRR
Which is more reliable: NPV or IRR?
When comparing NPV vs IRR, NPV is generally considered the more reliable metric because it shows the absolute dollar value an investment is expected to create. IRR is useful for understanding the rate of return, but in projects with unconventional or multiple cash flows, IRR can give misleading results. Therefore, most analysts prioritize NPV for decision-making while using IRR as a supporting measure.
What discount rate should I use for NPV?
The discount rate should reflect the opportunity cost of capital and the project’s risk profile. In practice, companies often use their Weighted Average Cost of Capital (WACC) as the discount rate, ensuring the calculation aligns with the real cost of financing. Using the wrong discount rate is one of the most common NPV errors.
Why is WACC important in NPV?
WACC serves as a realistic measure of the company’s financing cost by combining debt and equity costs. When used as the discount rate in NPV, it ensures that only projects generating returns above the company’s financing costs are accepted. This helps align investment choices with shareholder value creation.
Can IRR be calculated without NPV?
Technically, IRR is derived from the NPV formula since it is the rate that makes NPV equal to zero. While software like Excel can calculate IRR directly using the =IRR() function, behind the scenes it is still solving for the discount rate that balances the NPV equation. Therefore, IRR cannot be separated from NPV—it is fundamentally linked.
Conclusion
Mastering the ability to calculate Net Present Value and Internal Rate of Return is fundamental for making sound financial decisions. These tools go beyond simple return estimates by accounting for the time value of money, project risks, and financing costs. Whether you are assessing new investments, comparing projects, or evaluating long-term strategies, knowing how to calculate NPV in Excel and understanding its relationship to IRR ensures your analysis is rooted in accuracy.
Equally important is recognizing that IRR complements NPV rather than replaces it. By practicing how to calculate IRR from NPV, analysts gain a deeper insight into the break-even return rate and how it compares with actual expectations. Incorporating WACC as the discount rate further strengthens the reliability of these calculations, aligning project evaluation with the real cost of capital.
The more you practice with real-life datasets—using Excel functions, WACC-based discounting, and manual IRR approximations—the more confident and precise your financial decision-making will become. NPV and IRR are not just formulas; they are essential tools that guide businesses and investors toward sustainable value creation.